How Ad Format Affects CPI and ITI: Liftoff 2024 Data | Mobio Group
Liftoff, a mobile app marketing and retargeting platform that aims to increase traffic, sales, market share and revenue, has released its Mobile Ad Creative Index 2024 report. In this article, the Mobio Group team will look at its key takeaways — statistics and trends in CPI and conversion rates across app verticals in relation to ad format.
In the 16th edition of AppsFlyer’s Performance Index, which evaluated the leading media sources for mobile advertising, Liftoff is in the top 10: the platform ranked 6th for iOS apps (2nd in gaming categories and 7th in non-gaming) and 4th for excellent remarketing on Android.
Liftoff’s latest Mobile Ad Creative Index report is based on the platform’s 2023 data. The ad network analyzed 602 billion ad views, 49.4 billion clicks and 144 million app installs. Benchmarks for the five major mobile ad formats (banners, native ads, interstitial, interactive and video) are examined across four app verticals: gaming, e-commerce, finance and entertainment.
Gaming Apps
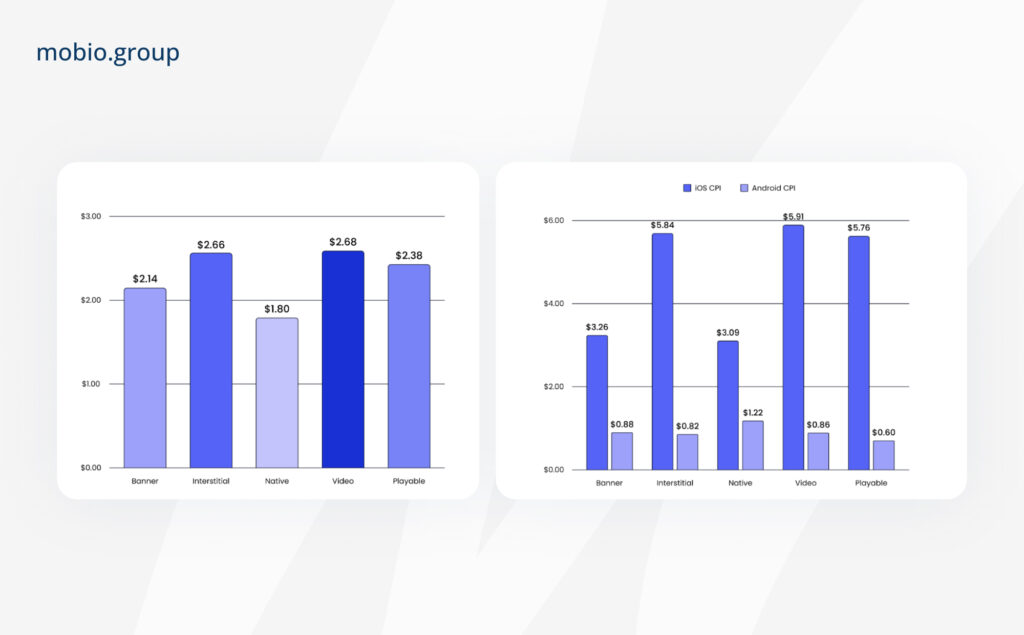
In early 2024, the average cost per install in the gaming category has decreased compared to Q1 2023. Traditionally, video ads remain the most expensive option ($2.68), while native ads ($1.8) remain the cheapest.
By Android/iOS platform, CPI varies significantly:
The most economical option:
- iOS — native ads ($3.09)
- Android — interactive ads ($0.6)
Most expensive option:
- iOS — video ($5.91)
- Android — native ads ($1.22)
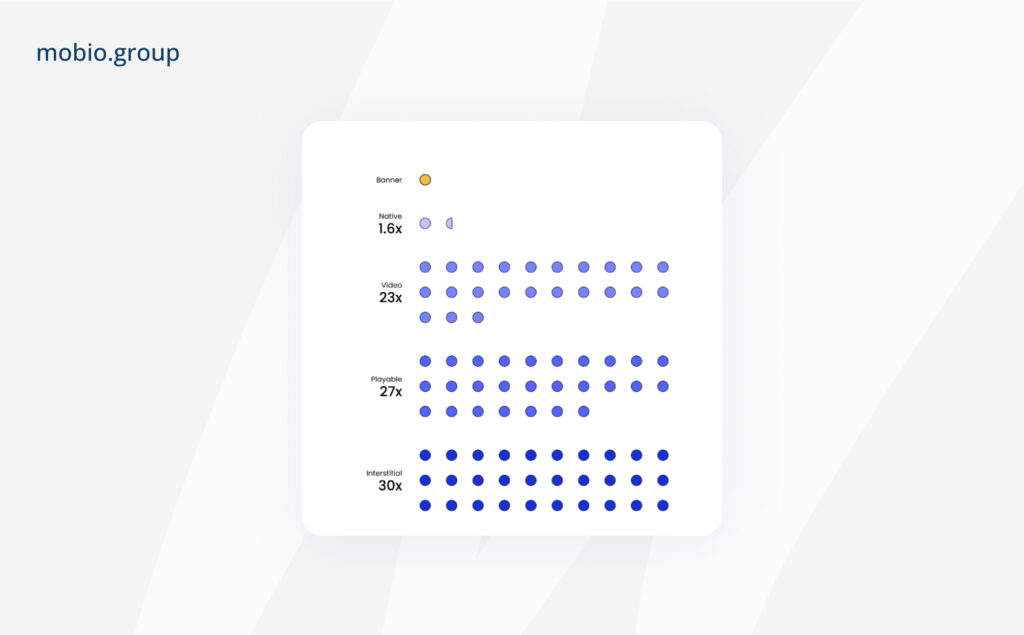
Liftoff’s report looks at Impression-to-install conversion by ad format. In gaming applications, ITI for video, interactive and interstitial ads outperforms banner and native ads. Interstitial ads convert to install 30 times more often than banners, while gaming ads convert to install 27 times more often.
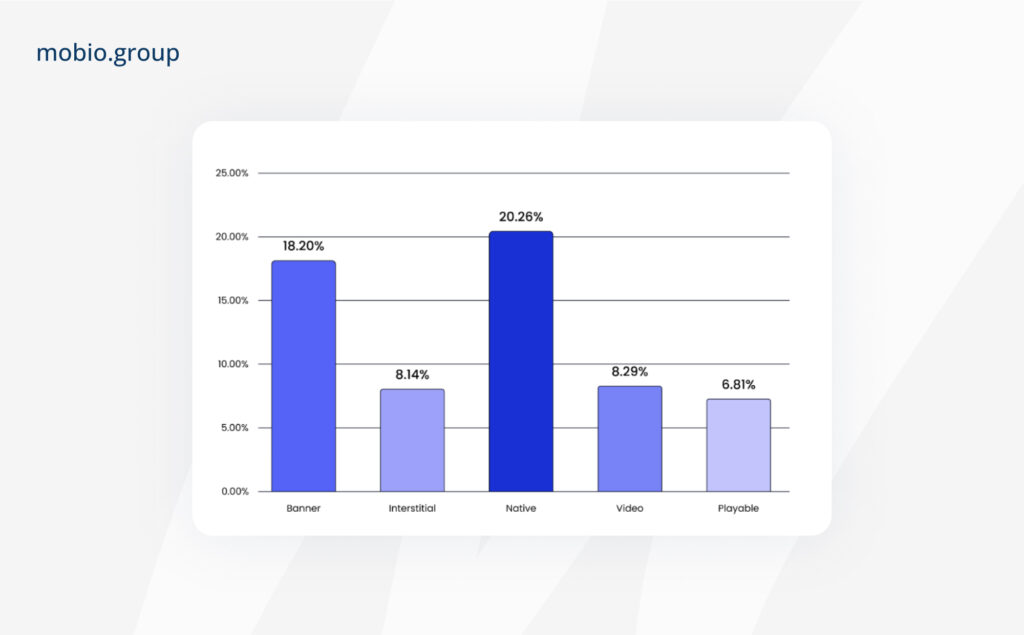
ROAS analysis into advertising on day 7 for different ad creatives showed that for game-apps:
- Native and banner ad formats significantly lead the way in delivering ROAS.
- Video and playable ads, although showing lower cost per install on Android platforms, lag behind in terms of ad ROAS on Day 7.
This analysis emphasizes the importance of evaluating ROAS over long periods of time, confirming with numbers that lower initial installation costs do not necessarily translate into higher long-term returns.
E-Commerce Apps
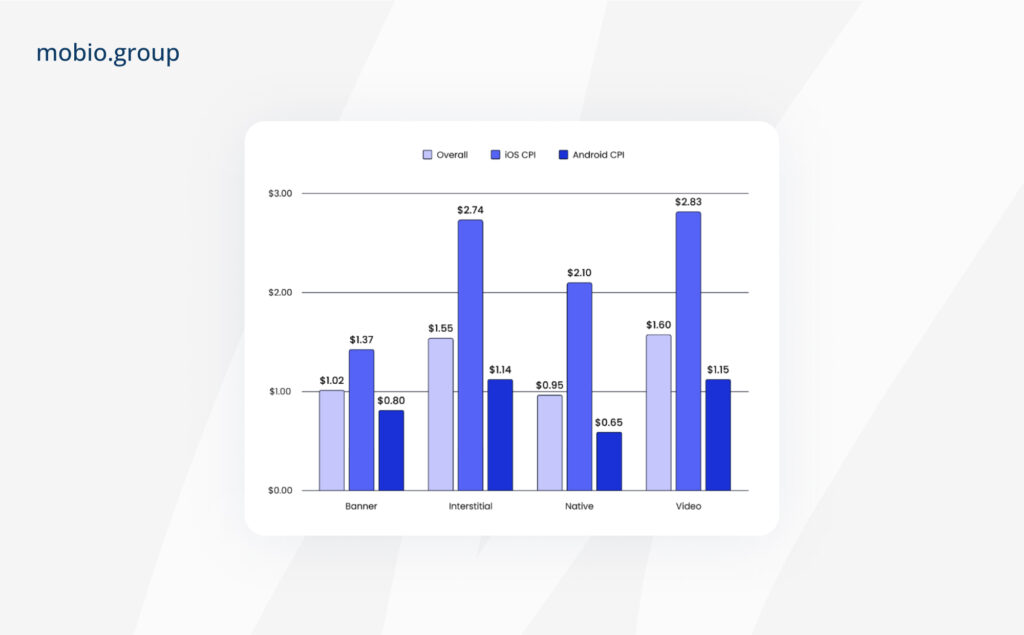
CPI by ad format in e-commerce apps ranges from $1.00-$1.60. Native ads are the most cost-effective format overall across platforms, while video ads are the most expensive. Platform Differences:
- Overall CPI across all ad formats is 1.6 times higher on iOS than Android.
- The iOS/Android difference is most significant in price for video ads (2x), full-screen ads (2.4x), and native ads (3x).
The most cost-effective ad option:
- iOS — banners ($1.37)
- Android — native ads ($0.65)
Most expensive option:
- iOS — video ($2.83)
- Android — video ($1.15)
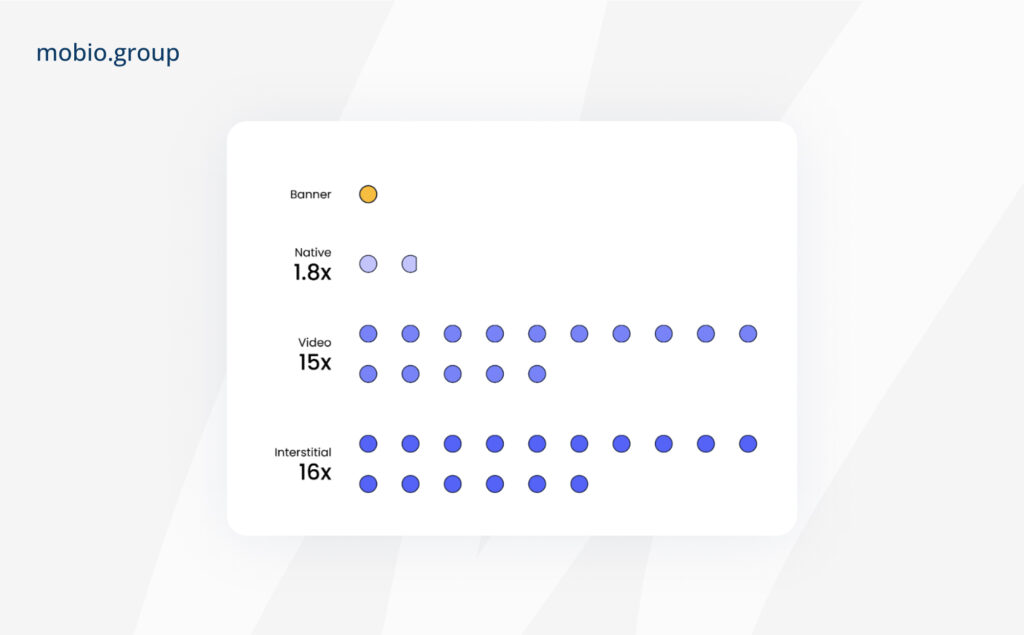
In E-Commerce applications, the choice of ad format directly affects the effectiveness of the advertising campaign, determining not only costs but also a key indicator — ITI (Impression-to-Install) conversion rate. In E-Commerce applications:
- Banner ads have the lowest conversion rate, behind all other formats.
- Video ads outperform banners in conversion rates by a factor of 15.
- Interstitial ads lead in ITI, outperforming banner ads by a factor of 16.
- Native ads convert 1.8 times more often than banners.
An analysis of CPA (Costs per action) and ITA (install-to-action) — the percentage of users who take a targeted action after installation) in E-Commerce apps showed that native and banner ads are not only more cost-effective, but also better at driving first purchases after app installation than video and interstitial ads:
Native ads:
- Lowest CPA: $2.57
- Highest ITA: 37%
Banners:
- Relatively low CPA: $3.23
- Second highest ITA: 32%
Video and interstitial ads:
- Have significantly higher CPAs ($9.78 and $9.67, respectively)
- Demonstrate low ITA (16% in both cases)
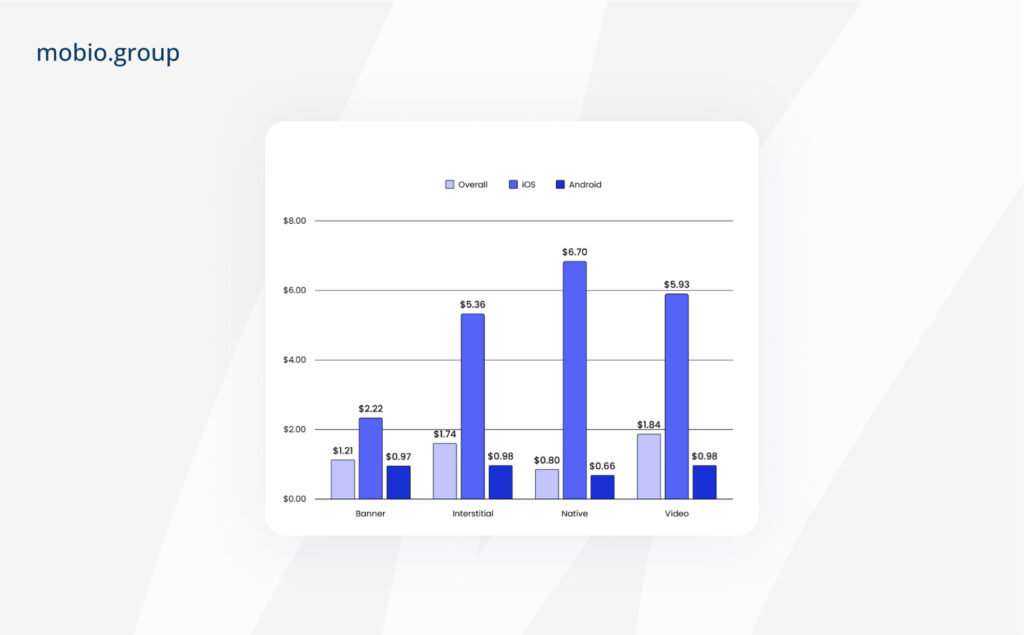
Finance
Despite a low average cost per install (ranging from $0.8 for native ads to $1.84 for video ads), CPI in financial apps varies between platforms:
iOS:
- Significantly more expensive across all ad formats — CPI of native ads is 10 times more on iOS than Android, video ads 6 times more.
- Installation cost on iOS is less than $2.5 only for banners.
- Native ads ($6.70) and video ($5.93) have the highest CPI.
Android:
- Installation cost of ad formats is below $1.
- Lowest CPI for native ads ($0.66) with the highest on iOS ($6.70).
- Cross-page ads are 5 times cheaper than on iOS.
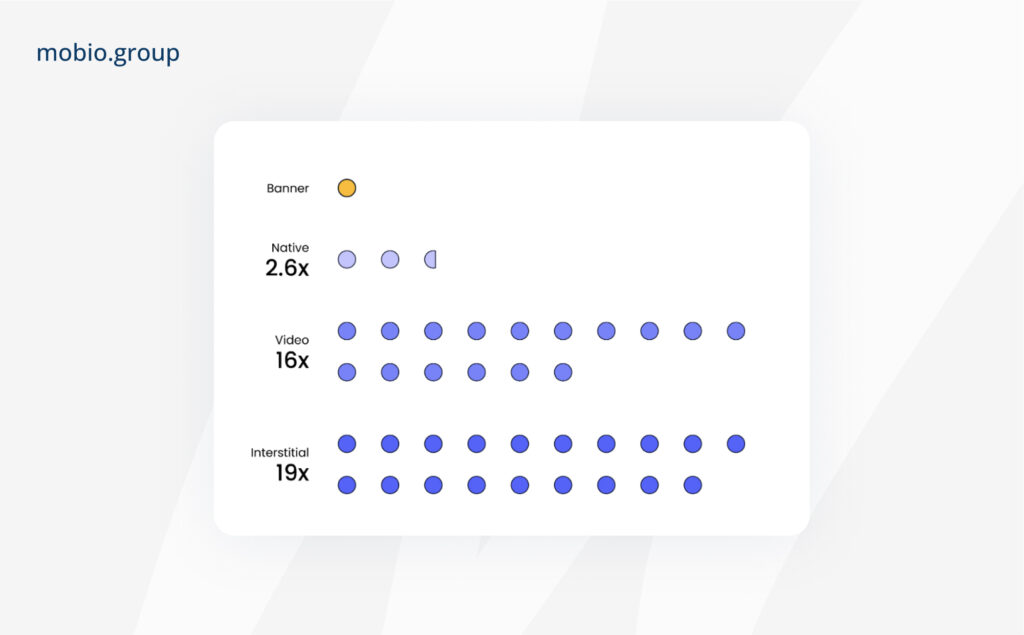
In terms of ITI (Impression-to-Install), video ads and interstitial ads are the most effective ad formats for financial applications. Interstitial ads have the highest ITI — they are 18 times more likely to convert than banner ads. Video ad impressions are 15 times more likely to lead to app installs.
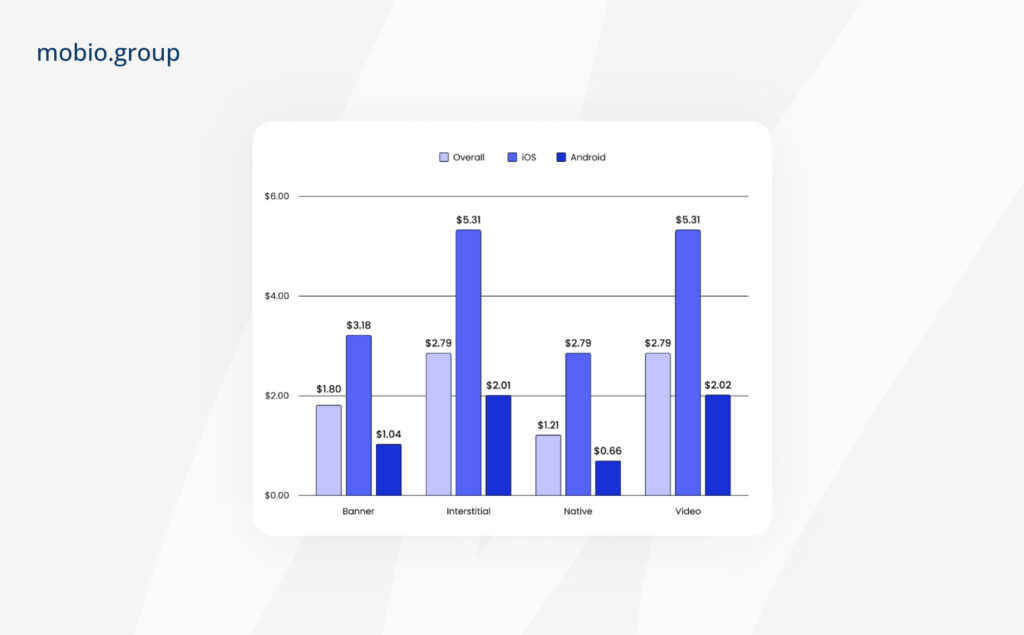
Entertainment
For entertainment apps, native ads have the lowest overall CPI ($1.21), video ads and interstitial ads are the most expensive ($2.79 each format).
As in other verticals, the cost per install varies significantly across platforms, iOS/Android:
- Interstitial ads and video ads have the same overall CPI ($2.79), but are 2.5 times more expensive on iOS ($5.31) than on Android ($2.01/$2.02).
- On Android the CPI of banner ads ($1.04) is 3 times less than on iOS ($3.18), the CPI of native ads is 4 times less ($0.66 vs $2.79).
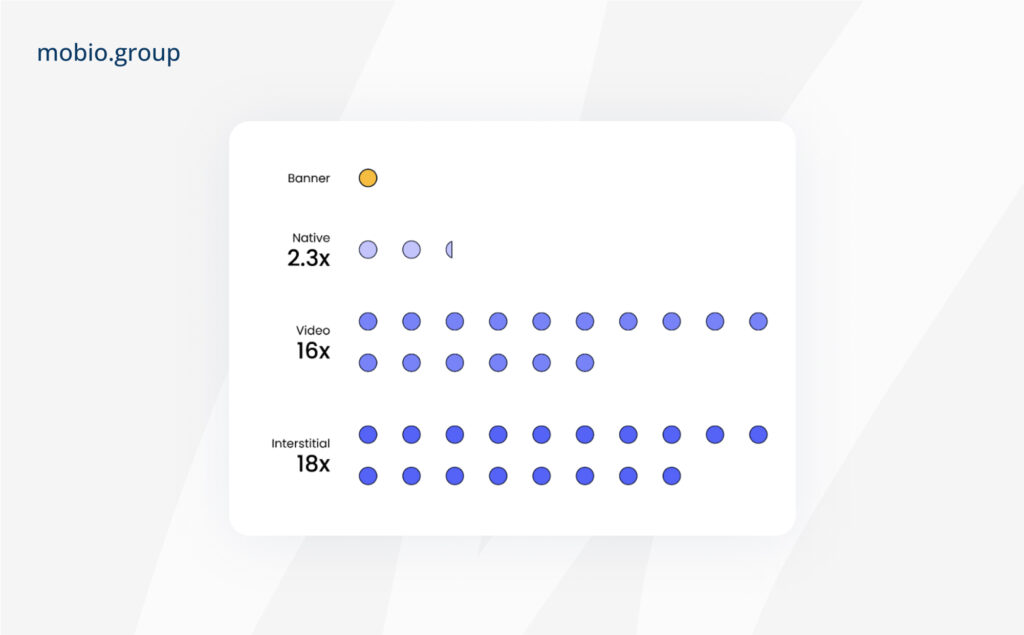
Banner ads in entertainment applications have the lowest ITI (Impression-to-Install), which indicates that they are the least effective in stimulating installations.
Video ads demonstrate a much higher ITI: video views are 16 times more likely to lead to app installs than banners.
Interstitial ads have the highest ITI: they are 18 times more likely to convert than banner ads.
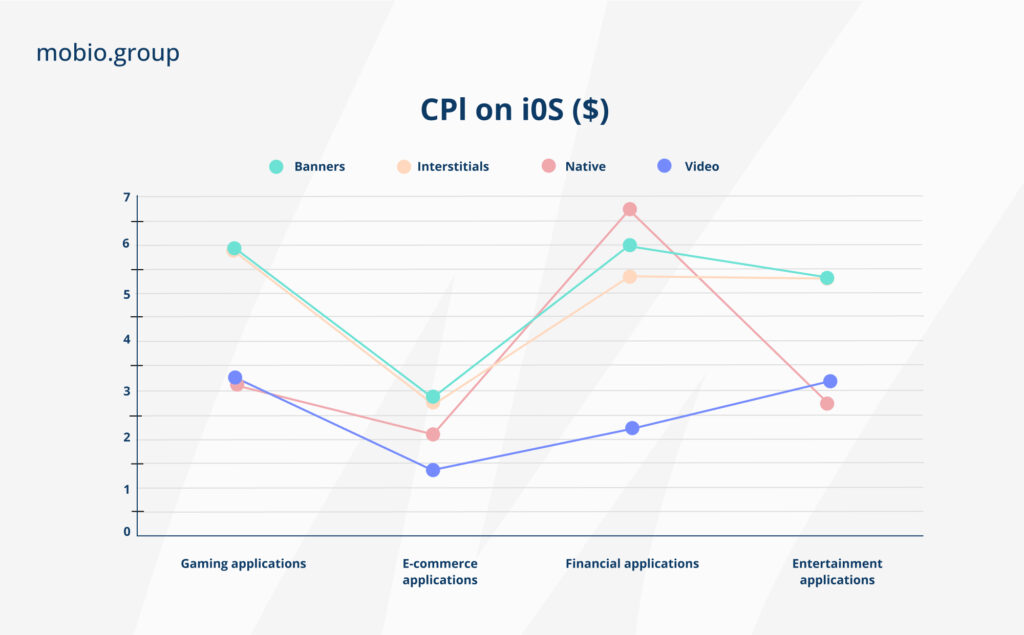
iOS: CPI Comparison of Ad Formats
Banner ads are the most cost-effective, second only to native ads in entertainment apps ($3.18 vs $2.79). In E-Commerce apps, banner CPI is less than 2x less than in gaming and entertainment apps.
Interstitial ads — have almost the same CPI as video, differing only in financial apps (-3%). Interstitial ads have the highest CPI in gaming apps ($5.84) and the lowest in E-Commerce ($2.74), although for E-Commerce interstitial ads are the most expensive along with video.
Native ads — have the highest CPI in financial apps ($6.7), which is more than 2x the cost per install in other verticals.
Video ads — have traditionally the highest CPI across all verticals, with virtually no difference in gaming and financial apps ($5.91/5.93). CPI in E-Commerce is less than 2 times lower ($2.83).
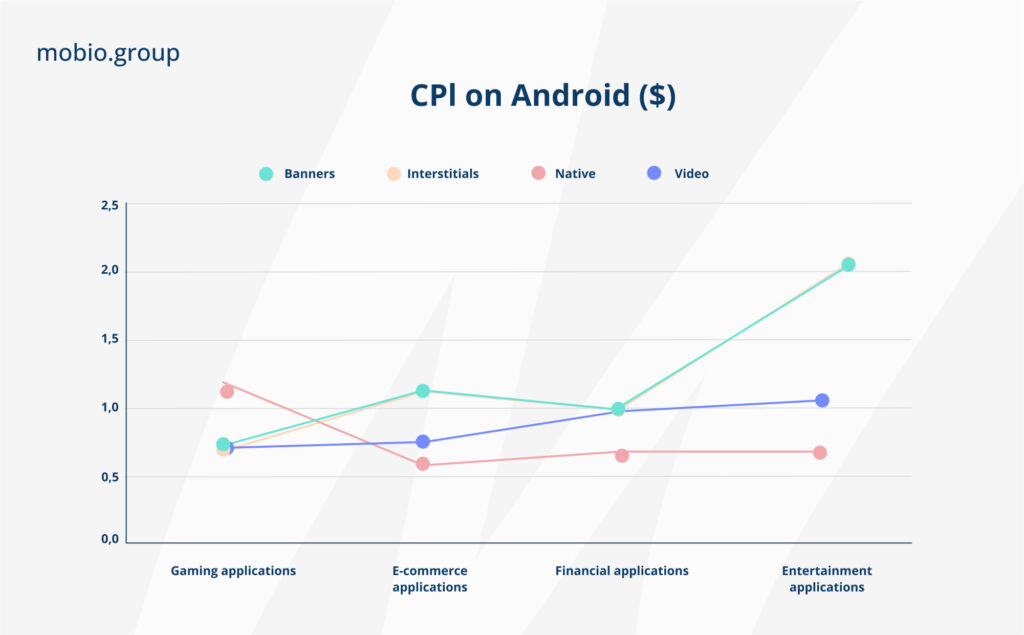
Android: CPI Comparison of Ad Formats
Banner ads — unlike iOS, banners don’t have the lowest CPI on Android, with gaming ($0.88) and financial apps ($0.97) on par with cross-page ads and video. The maximum install cost gap (30%) is between E-Commerce ($0.8) and entertainment ($1.04) apps.
Interstitial ads — having high CPI on iOS in gaming and financial app verticals, interstitial ads on Android leads in terms of cost per install in entertainment apps ($2.01) along with video. Yet it is 2x more expensive in entertainment than in gaming ($0.82) and financial ($0.98) apps.
Native ads are the most cost-effective ad for Android ($0.65-0.66). In gaming apps, the CPI of native ads is higher than in other verticals, almost 2x.
Video ads — are almost the same as interstitial ads in terms of CPI. The same trend is noted on iOS, but video on Android is almost 4x cheaper overall. CPI of video entertainment apps on Android is 2 times higher than for other verticals.
Creative Trends 2024 and Tips From Liftoff
The large amount of data analyzed for the report (602 billion ad views, 49.4 billion clicks and 144 million app installs) allowed the Liftoff advertising network to come up with some key recommendations for optimizing creatives in mobile promotion 2024:
1. Use UGC ads
User-generated or influencer-generated content about a brand has several advantages:
- Lower CPI: UGC creatives showed a 20% lower CPI compared to other video ads.
- Higher ROAS: UGC creatives increased ROAS by 4x compared to branded content.
- Higher conversion rates: UGC creatives increased impression-to-install (ITI) by an average of 152%.
2. Increase video ad length
40sec+ commercials are gaining popularity:
- Spending on long-form video ads grew 245% year-over-year.
- Share of 30-second videos dropped from 55% to 44%.
- The share of 45-second videos grew 24%, from 7% to 31%.
3. Combine different ad formats in a single ad
Such ads can combine a video, an interactive splash page and a final banner with a clear CTA. Ad spend on such ads grew 355% year-over-year.
4. Accelerate creative optimization with artificial intelligence tools
Localize and adapt content by using AI for subtitles, visual elements, adding a voiceover, or transitioning from 2D to 3D and back again.
As we can see, the ad format has a different impact on the cost of installation and conversion. For example, the native format is cheaper, but the conversion rate is higher for video ads. Therefore, when choosing the main format and preparing creatives for this format, we take into account the goals of the advertising campaign, the specifics of the target audience and advertising channel, budgets, vertical of the application and many other factors. Analyzing all these aspects on your own can be time-consuming and without proper experience, one can easily make mistakes. To avoid this, contacting professionals who have access to a wide range of tools and have extensive experience working with different advertising platforms and ad formats will promote your growth and success.
Vladislav Chernov, Performance Group Head, Mobio Group