IVT in Mobile Advertising 2024: A Record 23% of Fraud | Mobio Group

The year 2024 has been a record year for invalidated traffic (IVT) in mobile advertising. According to Pixalate, IVT reached 23% in the first quarter of this year, meaning that nearly a quarter of all ad impressions were generated by bots, fake devices, and other questionable traffic sources. In this article, the Mobio Group team will look at how IVT is distributed across different ad networks, platforms and app verticals and how to recognize such traffic in your ad.
“In the mobile performance marketing market, fraud is a serious and growing problem. Fraudsters are using increasingly sophisticated and diverse methods to deceive tracking and attribution systems. In recent years, fraud has become particularly active through schemes such as SDK spoofing and click injection”.
Nikita Makovets, Senior Affiliate Manager, Mobio Group
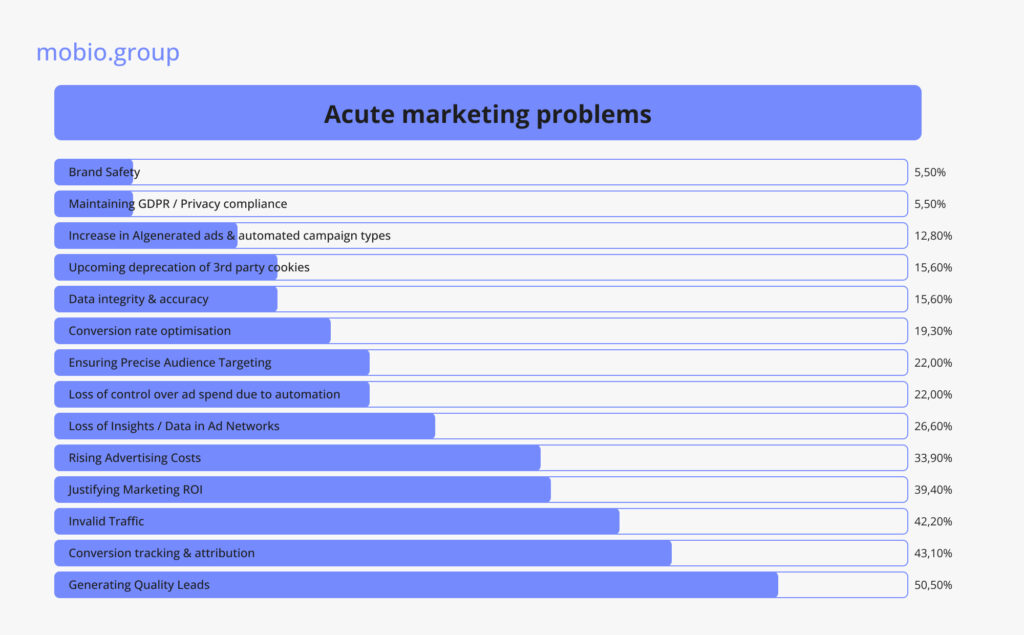
Advancement in technology is a definite plus for modern advertising. Progress in the digital industry helps to create personalized ads, predict customer behavior and optimize marketing campaigns with unprecedented accuracy. On the other hand, the rapid growth of opportunities leads to increased competition and complication of tasks that businesses face while promoting their product. The most pressing marketing challenges today:

Source: Lunio “Wasted Ad Spend Report 2024”
Leading the list of serious difficulties in promotion is Invalid Traffic (IVT), ranking 3rd (42.2%) on the list of marketing problems after generating quality leads (50.5%) and tracking conversions (43.1%).
Invalid Traffic (IVT)
Low-quality traffic, also known as unwanted or Invalid Traffic, refers to any activity created by users who are not interested in the advertised product. This type of traffic, which includes both accidental and fraudulent clicks on ads, provides no benefit to the brand and only distorts analytics because it includes data from untargeted audiences.
IVT traffic is categorized into two main types:
- GIVT (General Invalid Traffic). This is data center traffic, search robots, brand safety bots, and analytics tools. While this is Invalid Traffic, it does not mimic user behavior or steal clicks and ad impressions.
- SIVT (Sophisticated Invalid Traffic). This type of traffic is artificially created for fraudulent purposes and is difficult to detect because it mimics real user behavior. Advanced analytics are often required to detect SIVTs. For more on fraud and how to combat it, see our series of articles.
“SDK Spoofing: fraudsters mimic the functionality of legitimate SDKs by sending fake requests to tracking servers, allowing them to deceive advertisers and create the appearance of real app installs and user actions.
Click Injection: malicious apps intercept the installation process and insert fake clicks, giving the impression that the install was generated by their traffic. This results in the ‘theft’ of attribution from legitimate traffic sources”.
Nikita Makovets, Senior Affiliate Manager, Mobio Group
As investment in digital advertising grows, the SIVT problem is getting worse. Invalid Traffic reduces the quality of audience engagement, increases advertising costs, wastes the time and energy of sales and marketers, distorts analytics, and leads to unwise budget allocation. And the explosion of ad automation is only exacerbating the problem.
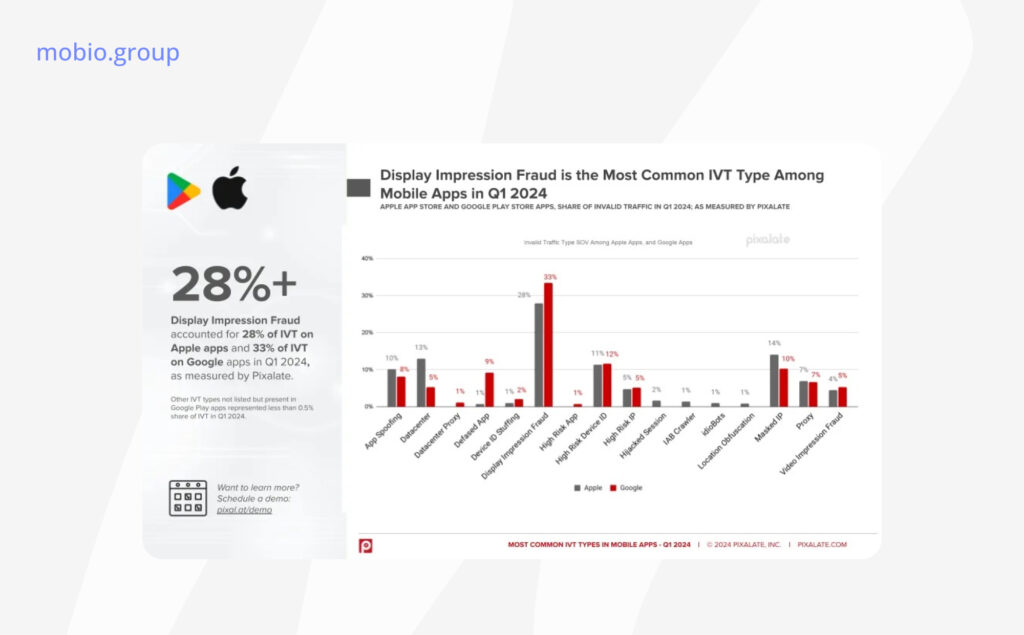
Pixalate, an analytics platform and fraud protection provider for advertisers, identified the five most common IVT types by mobile app platform in the first quarter of 2024, based on an analysis of app downloads from the Apple App Store and Google Play Store and ad impressions from open programs around the world:
- Display Impression Fraud. Apple App Store (28%), Google Play Store (33%). This refers to ads being displayed from the same browser or device at a statistically significant higher frequency than normal.
- Masked IP. Apple App Store (14%), Google Play Store (10%). This type of fraud includes ad impressions generated on the same browser or device at an inflated frequency, often falsifying location-related data.
- High-Risk Device ID. Apple App Store (11%), Google Play Store (12%). This type includes display ads coming from device IDs recognized as high risk sources of Invalid Traffic due to their association with dangerous or fraudulent activities.
- App Spoofing. Apple App Store (10%), Google Play Store (8%). A form of IVT in which traffic from one app is passed off as traffic from another.
- Proxy. Apple App Store (7%), Google Play Store (7%). Shows created by intermediary proxy devices that manipulate traffic counters, transmit Invalid Traffic, or do not comply with standard protocols.

Invalid Traffic reached 23% in Q1 2024 (according to a Pixalate’s Mobile Apps Invalid Traffic Benchmark Report based on an analysis of 5.1 million active mobile apps and more than 50 billion open programmatic ad impressions worldwide). This is a kind of IVT anti-record in the mobile advertising market. Almost a quarter of all mobile ad impressions were generated by bots, fake devices and other fake traffic sources. Google Play Store apps, meanwhile, were 18% more vulnerable to IVT than Apple apps.
In monetary terms, IVT losses in the first quarter of 2024 amounted to $1.4 billion. The Asia-Pacific region was the hardest hit, with IVT rates reaching 30%.
Display ad fraud was the most common type of IVT on both the Apple App Store (28%) and Google Play Store (33%).
Different Level of IVT in Different Advertising Networks
Invalid Traffic levels can vary significantly from ad network to ad network. This can be due to a number of factors:
- Network size and reach. Large networks with wide reach typically have higher IVT due to the sheer volume of traffic and the diverse sources they aggregate. Smaller niche networks may have lower IVT, but they can still be vulnerable to sophisticated attacks.
- Quality Control Measures. The level of IVT is often inversely proportional to the strength of an ad network’s quality control mechanisms. Networks that invest heavily in anti-fraud technology and utilize rigorous verification processes tend to report lower levels of IVT.
- Traffic sources. Networks that rely heavily on third-party traffic sources are more susceptible to higher IVT. These sources often lack rigorous quality checks, making it easier for fraudulent traffic to infiltrate.
- Geographic targeting. IVT levels can vary depending on the geographic targeting of the ad campaign.
- Ad formats. Different ad formats can attract different levels of IVT. For example, video ads can have higher IVT due to favorable payouts, making them a prime target for fraudsters.
“The number of fraudulent networks and platforms is also increasing in the market. These networks often disguise themselves as legitimate partners but actually provide low-quality or fraudulent traffic. This requires advertisers and agencies to adopt a more careful approach in selecting partners, conducting regular audits, and using advanced technologies for fraud protection”.
Nikita Makovets, Senior Affiliate Manager, Mobio Group
The wide reach and high engagement levels of social media have made it an attractive platform for those looking to monetize other people’s ads. Millions of people spend hours every day scrolling through Facebook, Instagram or TikTok feeds, absorbing information and advertisements. As a consequence, IVT levels on social media can be much higher than on other advertising channels, forcing advertisers to pay money for fake traffic without getting real customers.

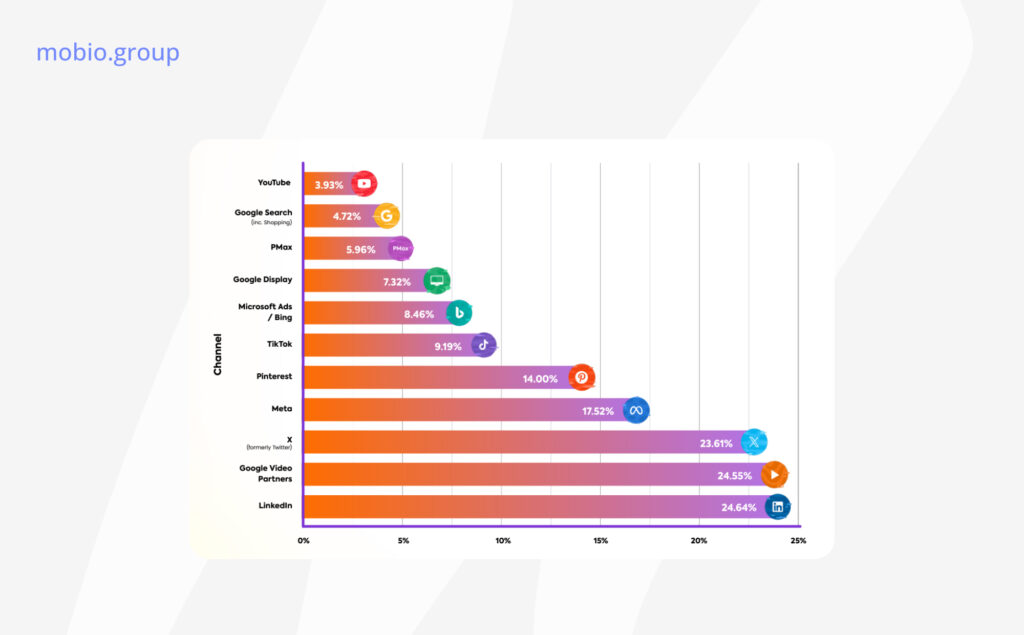
Источник: Lunio “Wasted Ad Spend Report 2024”
LinkedIn has the highest Q1 2024 IVT rate among advertising platforms according to Lunio research — 24.64% of traffic is considered Invalid Traffic.
Google Video Partners (GVP) also has a high IVT rate of 24.55%. Nearly one in four ad clicks are fake, suggesting that bot traffic is intentionally inflating ad performance. While Google disputes some of these claims, the presence of invalid clicks remains a serious problem for advertisers.
Since its takeover by Ilon Musk, Company X is struggling with an IVT rate of 23.61%. The ease of creating accounts on the platform allows for the proliferation of fake users, scrapers and bots that inflate ad performance.
Meta’s 17.52% IVT rate is worrisome given its large ad revenues. Despite Meta’s investment in anti-fraud technology, the high IVT rate indicates ongoing problems with fake users, resulting in significant financial losses for advertisers.
The IVT rate on TikTok is lower than on other platforms at 9.19%. Nevertheless, IVT still results in approximately $1.5 billion in ad spend annually.
Bing’s integration with ChatGPT has increased its user base and advertising investment. However, Microsoft Ads’ IVT rate of 8.46% is higher than Google Search, indicating less advanced detection systems.
Google Performance Max campaigns that advertise across multiple channels have an IVT of 5.96 %. Less control over targeting and ad types increases the risk of invalid clicks.
Google Search boasts a relatively low IVT score of 4.72%, due to robust detection and prevention systems. However, moving Shopping campaigns to PMax has increased IVT risks for some advertisers.
YouTube Video has the lowest IVT rate of 3.93% due to significant investment in anti-webotting defenses and sophisticated ad delivery mechanisms that discourage fraudulent behavior.
Different Levels of IVT in Different App Verticals
The susceptibility of mobile app ad campaigns to IVT depends on various factors: popularity and reach, monetization strategy, user engagement patterns, target audience, and so on. The vertical of the app also matters.
Gaming apps attract a large number of users, making the gaming category a prime target for IVT. Fake players may install an app to get rewards or in-game currency, with no intention of truly participating in the game.
Entertainment and streaming apps may face increased IVT due to their popularity and ability to manipulate engagement. Click farms can be used to increase installs or actions, especially for premium content or subscription-based services.
Finance or banking apps carry a moderate risk of IVT. Fraudsters may attempt to manipulate installs or actions to take advantage of financial incentives offered by ad campaigns.
E-commerce apps are also at medium risk, mainly due to fake installs, transaction spoofing, and simulated ad impressions.
Even in verticals that are less susceptible to IVT (education and learning, health and fitness or travel apps), fraudsters can find loopholes. This is a problem that affects all categories of mobile apps.
Signs of IVT in Mobile App Advertising
In order to detect Invalid Traffic when running an app promotion campaign, there are several ways for advertisers. The main signs of IVT to look out for are:
☑ Unusually high installs, registrations, or conversion rates
Compare metrics to other ad campaigns or industry averages. Traffic spikes can indicate the presence of “dead souls” and be a reason to check analytics.
☑ Low engagement
If users who have downloaded an app have few opens, extremely low engagement or no purchases, this could be a sign of IVT.
☑ Low session duration
The closer the session time is to zero, the higher the likelihood of IVT.
☑ Suspicious activity
Excessive saturation of user activity in a short amount of time or unusual purchases serve as a marker of Invalid Traffic.
☑ Geography mismatch
If the target audience in a particular region is small, but a large number of installs come from there, this is a reason to suspect IVT.
Not all the signs listed above are necessarily proof of Invalid Traffic. But, constant monitoring and analytics are needed to ensure that the advertising budget is not wasted. In the article “Fraud Prevention Standards & Anti-fraud Solutions”, we took an in-depth look at resources that can help advertisers, from App-ads.txt to standalone and embedded anti-fraud systems.
“Many companies are integrating anti-fraud solutions into their marketing strategies by collaborating with providers such as Adjust and AppsFlyer. These technologies help to quickly detect and block fraudulent activities, protecting advertising budgets. Additionally, advertisers are increasingly turning to domestic anti-fraud solutions, such as Fraudscore”.
Nikita Makovets, Senior Affiliate Manager, Mobio Group
Our years of experience working with advertising channels have shown that the most effective approach to fighting fraud is manual analysis and subsequent optimization. Unlike automated systems, manual analysis allows us to take into account a wide range of metrics and tailor our approach to each client. Mobio Group’s team has experienced analysts who specialize specifically in analyzing and recognizing fraud, allowing our clients to make the most of their advertising budget.
“The fight against fraud is becoming one of the key challenges for market participants. Companies that invest resources in anti-fraud technologies and employee education significantly improve their protection against fraud and increase the effectiveness of their marketing efforts”.
Nikita Makovets, Senior Affiliate Manager, Mobio Group
If you’d like to find out more about how we can help you, get in touch.


