AARRR Framework: A Guide to Growth | Mobio Group
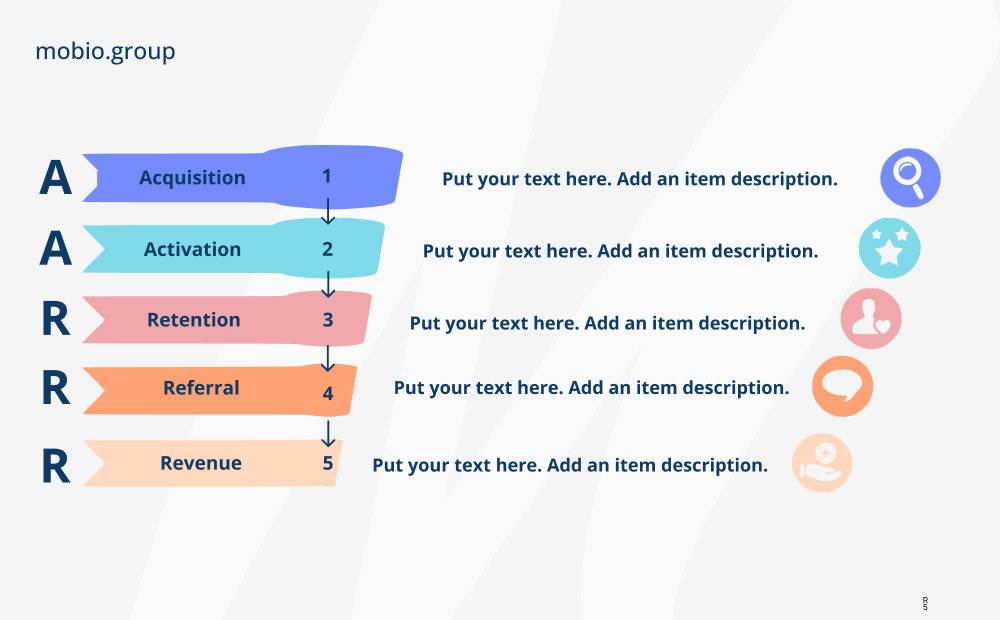
One of the main models for measuring business growth is the AARRR framework. This framework allows you to divide the user journey into five distinct stages and map them to relevant metrics, allowing you to effectively track the customer journey from initial touchpoint to key conversion point. In this article, the Mobio Group team will reveal the essence of the AARRR framework, break down its main components, and review the metrics analysis which helps optimize marketing efforts and ensure sustainable product growth.
The framework, known as AARRR metrics, is used as part of a customer-centric approach to help companies understand user needs and behaviors at every stage of the user journey, identify bottlenecks, and develop accurate marketing strategies. To identify areas of product development that need improvement and thus optimization, the AARRR method involves dividing the customer lifecycle into five distinct stages, each of which is subject to rigorous analysis.
Despite its similarity to the marketing funnel structure, the AARRR matrix differs in that it takes into account the phases of product development, allowing you to focus on those phases that require refinement.
The AARRR framework is often intertwined with the concept of “Growth hacking,” but it was born a bit earlier, in 2007, when Dave McClure, head of marketing at PayPal and SimplyHired and founder of 500 Startups, spoke in Washington State at the Ignite Seattle event, pointing out that many companies focus on the wrong growth metrics and vanity metrics. McClure’s AARRR funnel helps a growth team identify specific points of focus, identify change-sensitive metrics, and test multiple hypotheses in parallel.
With AARRR, companies use the correct data to measure the success of their product management and marketing efforts, improve those initiatives that aren’t working, and focus only on the metrics that directly impact the health of their business.
At its core, AARRR is a product diagnostic tool that identifies areas in need of optimization. When exploring the framework, you need to break down each step of the framework in detail.
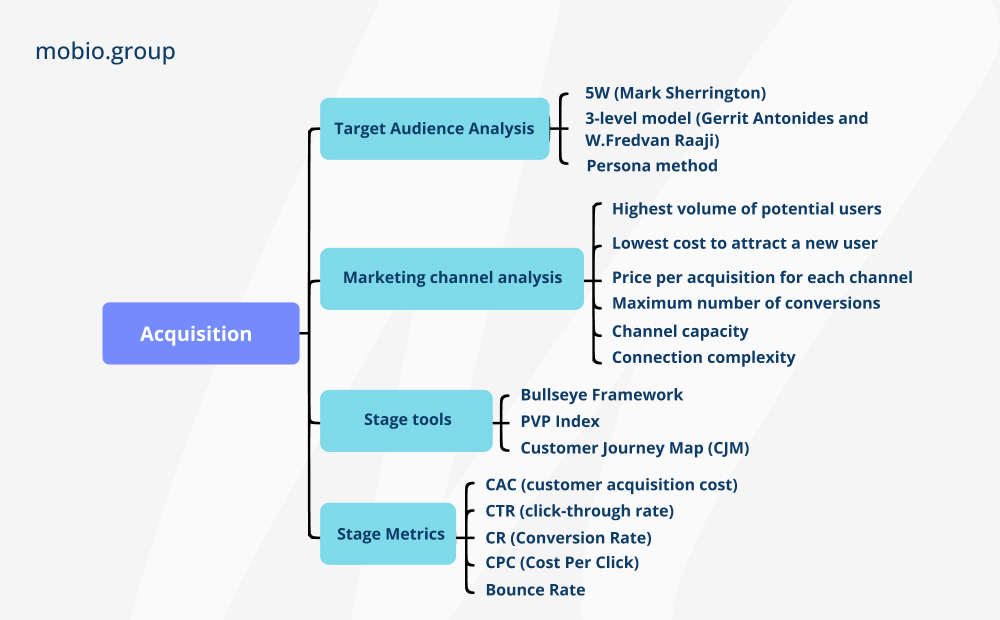
Stage 1 — Acquisition
The very first stage of the customer lifecycle includes the basic goal of familiarizing potential users with the brand and the services offered. However, the essence of successful acquisition is not simply to get the audience interested, but to build relationships with the right customers. For a product to be truly in demand, the growth team must answer the following questions:
1. Who will use the product?
A clear understanding of the audience lays the foundation for building a product that meets the true needs of users. The one-size-fits-all approach loses its relevance. Instead, targeting specific customer segments becomes paramount. This approach not only saves resources, but also facilitates effective communication.
2. Where do new users come from?
Attracting customers proves to be a challenge, and the lack of new customers often results in a loss of companies, especially SaaS companies and startups. As such, identifying marketing channels that demonstrate “traction” becomes critical. “Traction” refers to the momentum that occurs when a strategy proves effective. Among the entire arsenal of systematic approaches, one of the best is the Bullseye Framework developed by Gabriel Weinberg. The framework outlines 19 different channels of engagement, from content marketing and SEO to social and viral marketing, where each channel provides a unique opportunity to engage and connect with potential customers, driving the buying process.
Bullseye Framework suggests considering all channels that can attract traffic, but after researching each one, focus on one channel and test its effectiveness for the business in a small version. Followed by scaling up if successful. This is essentially the MVP version of the MVP process for testing an acquisition channel. By determining which channel helps garner the most support, a company should focus its marketing efforts on select high-performing channels rather than spreading itself across multiple channels with low ROI. Weinberg argues that for every business at different stages of growth, one single channel will be the primary driver of traffic. If every “pull” channel is failing, then there is probably something wrong with the product or market itself.
Thus, at the customer acquisition stage, the basic principle remains the same: identify the customer base and focus on marketing channels that provide minimum cost and maximum return.
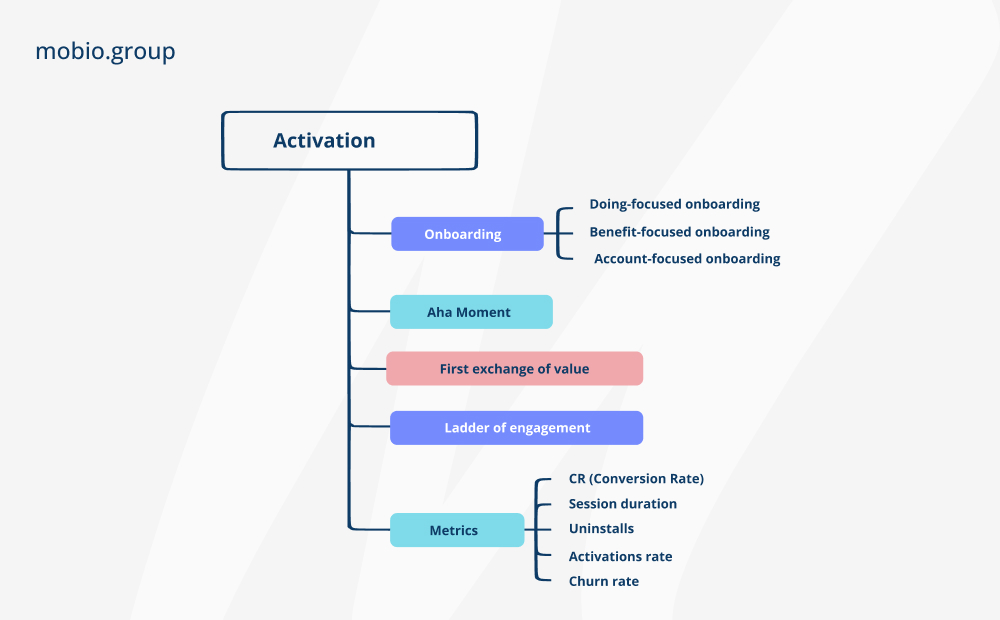
Stage 2 — Activation
User activation only matters once product-market fit has been achieved. When the product fails to offer significant added value, even the most ideal activation process fails.
There are various reasons why new users may not return to a product:
- Unmet needs. Users may not have a pressing need that the product fulfills, resulting in a loss of interest.
- Improper positioning. The product team may be attracting the wrong users.
- Insufficient value. Users may not perceive the value of the product as high enough for regular use.
- Lack of communication. The value of the product may be ineffectively communicated or poorly explained.
Thus, the main goal is to quickly communicate the value of the product to new users by providing them with an experience that goes from “Just another service” to “Wow, this is what I’ve been looking for” — the legendary “Aha Moment.”
In fact, in marketing, the “Aha Moment” is the simplest indicator of user engagement, meaning that they understand the value of a product and decide to use it regularly.
The following structure can be used to describe the “Aha Moment”: “User takes X actions within Y days of signing up”, which requires research on three dimensions:
- Key Action: user experience studies where customers “test” the product and realize its value. This could be subscriptions, installs, messages sent, etc.
- Number of key actions.
- Time interval for actions.
Analyzing different combinations of actions, their number and time will reveal the combination most correlated with user retention.
It is very important to consider the “Time to value” factor — if users fail to quickly realize the value of the product, the risk of losing them forever is very high. The sooner a new user experiences the added value, the more likely they are to choose the product over the alternatives. That said, the Time to value metric varies widely. For example, a hyper casual mobile game may bring a user to realize the value of a product as soon as 30 seconds after the first launch, while achieving the “Aha Moment” in a task tracker like Asana may take weeks. And those weeks can’t be compressed into minutes with adaptation optimization.
Effective measurement of activation depends on the proportion of users who realize the added value and continue to use the product. Metrics that reflect the proportion of new users who regularly use the product for their tasks are appropriate. These metrics should reflect the amount of “work” the product brings to customers’ lives. The more “work” a product can take away from alternative solutions, the stronger its market fit.
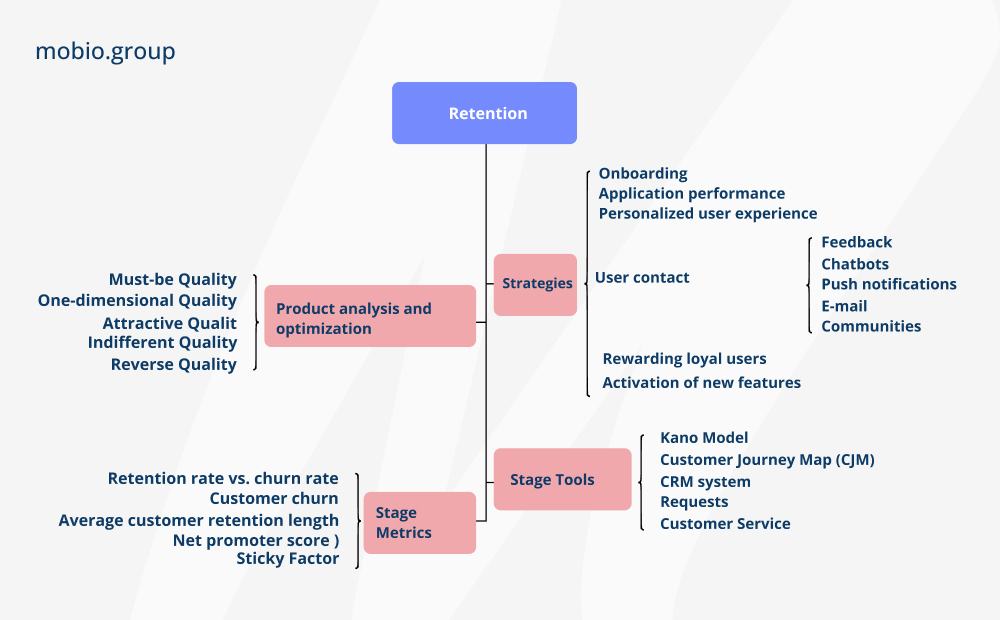
Stage 3 — Retention
In addition to creating a valuable product and attracting attention to it, maintaining a strong connection with users is paramount. Understanding the reasons why customers stop using the product and a well thought out retention strategy will minimize user churn.
Retention refers to the total number of users who continue to engage with an application over a period of time. Typically, retention rates are measured at day 1, day 7, and day 30. That said, it is important to realize that no app can retain all of its downloads. The challenge is to create a user interface and experience that will retain and attract a certain percentage of users each month.
Global user retention rates show that on average across 31 categories of mobile apps, the rate drops from 25.3% on day one to 5.7% by day 30. Within the first three days of installation, an app loses about 77% of its daily active users (DAUs). For detailed statistics by category, see our article “Uninstalling Apps“.
Customer departure from a product is tracked by the churn rate, which serves as an indicator of product-market fit. A high churn rate after the first use indicates a flawed product or message. To achieve meaningful growth, the churn rate must be significantly lower than the engagement rate.
Customer Acquisition Rate > Churn Rate = Growth
Customer Churn Rate > Customer Engagement Rate = Financial Leakage
Investing in user retention is further justified by the fact that it costs 5-25 times more to acquire a new customer than to retain an existing one. Moreover, selling to past customers or renewing subscriptions is easier because of established trust, making cross-selling, add-on or repeat sales more cost-effective and efficient than cold-selling.
The struggle to retain users is an ongoing process. Methods and strategies can change from app to app, or from promotion stage to promotion stage. The main ways to maintain high levels of engagement:
- competent onboarding and a simple onboarding process
- good app performance
- personalized user experience
- сonstant contact with the user (feedback, chatbots, push notifications, e-mail)
- rewarding loyal and engaged users
- activation of new features
Among the effective schemes for identifying key features valuable to the user and prioritizing their implementation is the Kano model. This marketing tool categorizes product features into five key categories:
- Must-be Quality (qualities that must necessarily be present in a product)
- One-dimensional Quality (strong unidimensional features generate satisfaction, weak unidimensional features generate dissatisfaction). This could be ease of use, cost, safety, etc.
- Attractive Quality (key characteristics that may be unexpected and help in addressing a previously unmet need)
- Indifferent Quality (the user does not care whether the product has them or not)
- Reverse Quality.
In the user retention phase of the AARRR framework, Kano’s model plays a meaningful role. By identifying which features fall into each category, the company is able to focus on improving those aspects that provide the most value to users and adapt the product to changing expectations.
Stage 4 — Recommendations
The referral stage is where existing satisfied customers actively recommend a product or service to others. Implementing a well-structured referral strategy into the business model can generate significant growth through solid recommendations and community expansion. C2C (customer-to-customer) or B2C (business-to-customer) referral programs are implemented.
Different types of referral programs provide businesses with the ability to choose the approach that best fits their goals, target audience, and overall marketing strategy. The main types of referral programs are:
☑ One-way referral program
In this simple program, only the referrer is rewarded for successful acquisition of new customers. Referred customers do not necessarily receive any incentives.
☑ Two-way referral program
In this program, both the referrer and the referred customer receive rewards. Both parties receive benefits such as discounts, credits, or other incentives.
☑ Advocate Referral Program
Advocates are loyal customers who refer others without direct incentives. Instead, they genuinely believe in the product and its value.
☑ Influencer Referral Program
Companies partner with influencers or celebrities who recommend their products or services to their followers, often through social media platforms.
☑ Affiliate referral program
Affiliates promote a company’s products or services using unique affiliate links. They receive a commission for each sale made through these links.
☑ Referral Loyalty Program
We reward existing customers participating in the loyalty program for recommending friends, which helps both retain customers and attract new ones.
☑ Tiered referral program
As referrers attract new customers, they receive increasing rewards. This encourages them to keep referring customers and helps to attract more valuable customers.
☑ Pre-launch referral program
This program, implemented before the official launch of a product or service, creates excitement by offering exclusive incentives for first-time referrals.
☑ Cross referral program
Companies in complementary businesses cross-promote each other’s products, benefiting from mutual referrals.
☑ In-app referral program
Mobile apps often utilize this program, enabling users to refer friends directly from the app, typically through unique referral codes or links.
☑ Employee referral program
Internal referral programs encourage employees to refer potential customers to the company.
☑ Charitable referral program
For every successful customer referral, the company donates funds to a selected charity organization, which helps combine brand values with social impact.
☑ Game-based referral program
Incorporates game elements such as leaderboards, challenges and rewards to make the referral process fun and competitive.
☑ Contest-based referral program
Rewards users for referring friends in exchange for the opportunity to win prizes, which drives interest and engagement.
One of the best (and cost-effective) ways to develop a brand is word-of-mouth (WOM – word-of-mouth). Word of mouth refers to informal communication between people, where people share their impressions, opinions and recommendations about products, services or brands with others. It is a powerful form of communication based on personal trust and authority. Positive word of mouth can significantly influence consumer decisions, driving product adoption, brand loyalty and business growth. WOM spreads through word of mouth, social media, online reviews and other interactions (read more in our article “User-Generated Content“).
We use the following metrics to evaluate the effectiveness of the referral stage:
- Virality factor (K-factor) — a metric that determines the number of additional customers acquired per existing customer. It is calculated using the formula: K-factor = Number of invitations sent out * Invitation Conversion Rate. A virality factor exceeding 1 will mean exponential growth. There is also such a formula: K-factor = 1 + (number of organics/number of paid installs).
- Net Promoter Score (NPS) — an indicator that measures user loyalty and churn probability. It is calculated using the formula: NPS = Promoter Share – Critics Share. Most often counted as a percentage, above 30% is good, above 50% is excellent, above 75% is great.
Stage 5 — Revenue
Generating revenue is the natural goal of any business. But the desire to increase revenue also breeds a natural mistake many entrepreneurs make — the desire to expand their target market to include as many potential customers as possible. The mistake is that for a successful marketing strategy, a business needs to focus not on “breadth of coverage” but on generating and retaining effective leads at the lowest cost and best targeting.
A 100W light bulb, similar to the light bulb we can find in our homes, is capable of illuminating a room. In contrast, a 100W laser is capable of cutting through steel. Same energy, but a completely different result. The difference lies in how the energy is concentrated. The same can be said for marketing.
Allan Deeb
The basis for finding a target market and “qualified” users is the PVP approach (Personal fulfillment — self-actualization, Value to the marketplace and Profitability — profitability), where different market segments are rated on these criteria on a scale of 1 to 10. Using the PVP index helps in understanding how competitive the product price is, how the market price of the product changes over time and how customers will perceive the product.
The disadvantage of the PVP approach is that it does not take into account other factors such as product quality and customer service, market trends and brand reputation. Therefore, the index is not the only criterion for accurately assessing the price of a product or the success of a marketing campaign. Important metrics in the revenue phase are:
LTV (CLV) — Customer Lifetime Value
CAC — Cost of Customer Acquisition
MRR — Total Revenue Received by the Company for a Month
Revenue Churn — the Value of Money Outflow
AOV — Average Check
Expansion revenue — Revenue Growth
The AARRR framework is a reliable reference point for those seeking rapid and sustainable growth. The framework serves as a valuable set of markers that allow companies to measure conversion and respond to important customer prompts at various stages of the customer lifecycle. As data and insights are collected, guided by the principles of AARRR, companies identify areas for product improvement through multiple A/B tests.
The AARRR system’s value lies in its adaptability because it doesn’t rely on rigid protocols or universally applied set formulas. Instead, it offers a systematic approach that allows it to adapt to the unique characteristics of a particular product, the customer journey, and changing business priorities. The framework provides the ability to focus on one or more phases of the AARRR system at any given time, depending on current goals and circumstances. This customization allows for continued flexibility in the pursuit of growth and customer satisfaction.
The Mobio Group team’s expertise is a valuable resource along the way. Our skill lies in identifying accurate metrics relevant to each stage of product development. Using analytics software, we create an optimized conversion funnel tailored to our clients’ specific needs. This collaboration will allow you to effectively navigate the AARRR system and ensure sustainable growth of your business.
FAQs
1. When is AARRR useful?
The AARRR approach is useful not only for scaling businesses, but also for growing companies at different stages of development — startups can also use it during the implementation and initial sales phase. The framework helps in understanding from the beginning how to attract, engage, retain, monetize customers and assess the product’s potential for global expansion.
In addition, AARRR remains relevant in the later stages of business development, especially when there is a need to enter new markets and grow new segments of the target audience. This strategic rethinking helps companies avoid the risk of stagnation and focus on continuous growth.
2. How does the RARRA concept differ from AARRR?
The AARRR concept is known for describing the customer journey in a sequence of ‘acquisition’, ‘activation’, ‘retention’, ‘recommendations’ and ‘revenue’. However, its counterpart, known as RARRA, reverses this sequence by emphasizing different stages based on their importance. In RARRA, the sequence becomes “Retention,” “Activation,” “Referrals,” “Revenue,” and “Acquisition.”
Interestingly, despite the sequence change, the key questions and indicators for each stage remain the same in both systems. However, what distinguishes RARRA is its particular focus on the retention stage. This strategic shift stems from the realization that many SaaS companies face challenges not in acquiring customers, but in retaining them.
Moreover, the logic behind prioritizing retention is based on financial efficiency. Retaining existing customers is generally more cost-effective than acquiring new ones, making it a reasonable priority for businesses.
However, prioritization is not a one-size-fits-all determination. You should tailor the choice between both AARRR and RARRA to your company’s unique dynamics since they are both complex tools. Ultimately, it’s most important to pay attention to the key metrics and realize that true growth often depends on customer retention, not just customer acquisition.
3. Why are these metrics called “pirate” metrics?
The term “pirate metrics” relates to a mnemonic technique that helps you memorize the key stages of customer development. These stages — Acquisition — Activation — Retention — Referral — Revenue — are collectively known as AARRR. The twist is that when spoken quickly, these stages sound like the menacing cry of a pirate: “AARRRR!”. This play on words not only makes the system memorable, but also brings a touch of adventure to the analytical world of business metrics. Thus, the name “Pirate Metrics”, although not directly related to pirates, conveys the spirit of exploration and conquest.