Navigating Mobile Marketing: The AppsFlyer Performance Index | Mobio Group

Choosing an effective media source has become a challenge for advertisers in recent years. Data privacy issues, limited ad budgets for app installs and the general turbulence of the media space have only made the selection process more difficult. Most mainstream media is in a slump, and channel performance continues to fluctuate. However, AppsFlyer’s 16th Edition Performance Index, which evaluates the top media sources for mobile advertising, will help marketers make informed decisions. In this article, Mobio Group’s mobile marketing team will break down will break down AppsFlyer’s scores in detail and present the report’s key findings.
Media Source Assessment
To calculate AppsFlyer’s performance index, 11.5 billion inorganic installs across 30,000 apps and 75 media platforms were analysed between April and September 2023. The criteria included presence in both gaming and non-gaming verticals.
Android Index:
- Android Index Volume Ranking took into account the total number of genuine installations for each media source.
- The Power Ranking was determined by a combination of the number of genuine installations, the number of apps launched from each media source, the fraud rate and the retention rate (calculating the ratios for inorganic and organic users on day 1, 3, 7, 14, 30, week 8 and week 12).
SSOT Index for iOS:
The SSOT Index for iOS follows the methodology of the Android index, but with adjustments to account for the lack of regional data. The volume ranking by GEO was based on the share of each region and category in the media source’s total traffic volume.
Remarketing Index (Android):
The remarketing index for Android evaluated attributed conversions and revenue from them, taking into account the difference between non-organic and organic average revenue per user.
Performance Index Android
Power ranking:

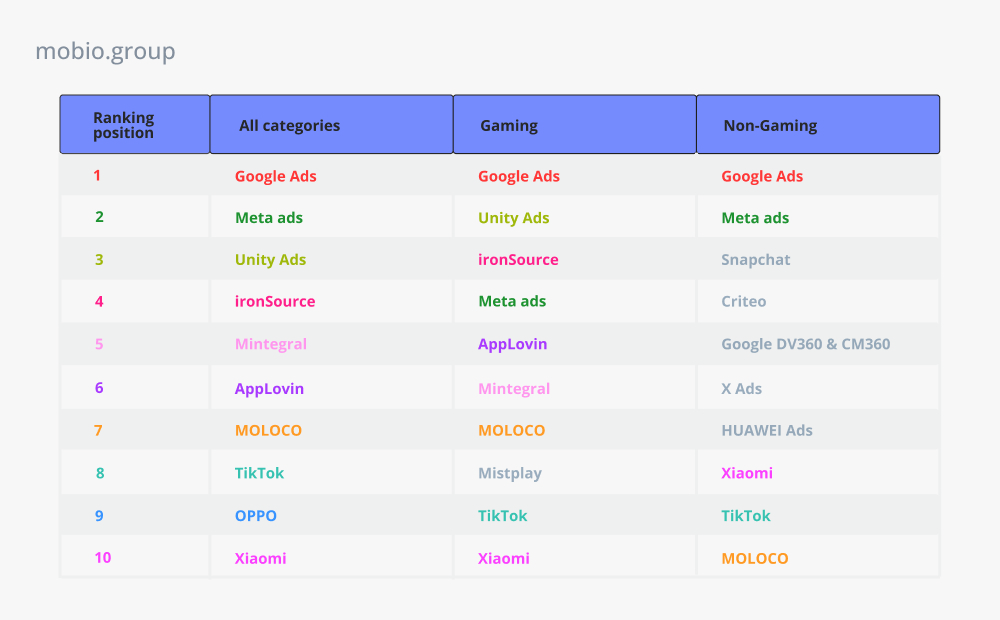
The top spot of the Android rankings goes to Google Ads, but further winners are unevenly distributed across the gaming and non-gaming sectors:
➲ Gaming sector:
- Google Ads widens the gap with Unity, ranking 1st in power and volume in all categories (2nd only in casino and hyper casual games).
- Unity Ads lags behind in volume (5th position), but ranks 2nd in the global rankings with excellent performance in Match, Puzzle, Shooter, Board Games categories.
- IronSource made a leap in the global ranking, taking 3rd place. Growth was driven by strong performance in Hypercasual and Action in EMEA, North America and APAC.
- Meta Ads rose to #4 in the global strength ranking, improving on previous performance driven by Casino (#1), medium complexity games (role-playing, shooting, strategy), and Puzzle, Sports and Racing games.
➲ Non-gaming sector:
- Google Ads and Meta ads dominate in both power and volume, except in the Short Videos category, where they are behind Vivo (1st place), OPPO (2nd place) and Xiaomi (3rd place).
- Meta ads moves to 3rd place in the Personal Loans category, behind Buddy Loan.
- TikTok For Business takes the 3rd position in terms of volume, but is 9th in terms of power. TikTok’s performance in the Utility Group (4th place) and Finance (6th place) categories is good.
- Chinese media resources Xiaomi, Vivo and OPPO also demonstrated their ability to scale, taking a combined total of nearly 10% of the index’s global volume.
- AVOW was in the top three (3rd place) in Finance, Criteo in Life/Culture, Appnext in Personal Investing, and AppLovin in Utility Group.
Performance Index iOS
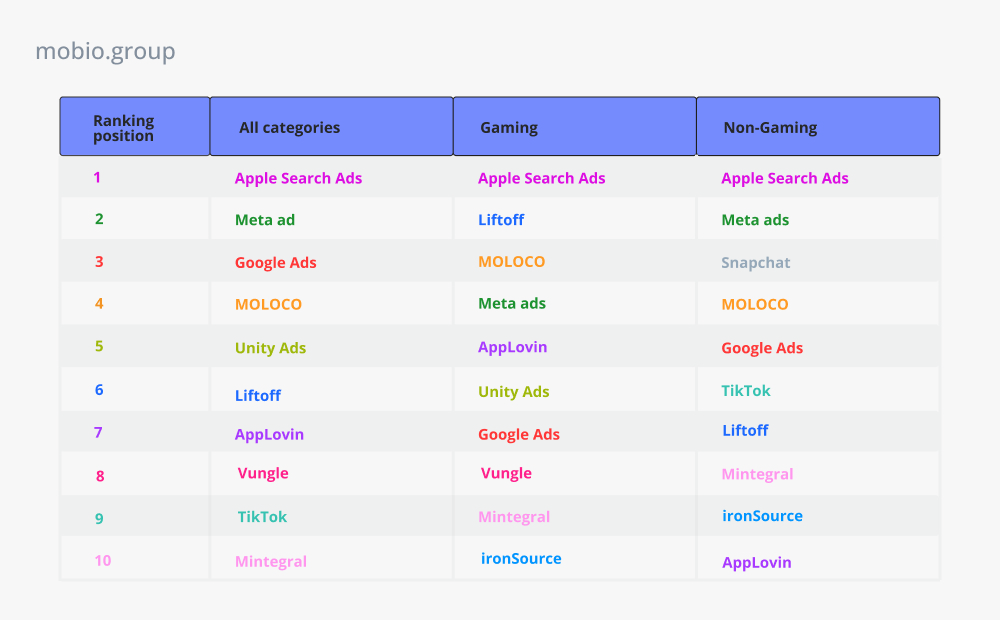
ASA operates independently of SKAN, deterministically attributing users without regard to ATT consent. The 16th edition of rankings from AppsFlyer shows that Apple Search Ads is the most significant media source for iOS apps.
While Meta ads on iOS are not as strong as they were prior to iOS 14.5, they have adapted and now rank second in both power and volume. The success is aided by Meta ads’ non-gaming apps on SCAN, which has more installs than its competitors.
Google Ads ranked third in the global ranking, primarily due to its large presence.
Power ranking:

Apple Search Ads (ASA) attracts the highest quality traffic, ranking first as a media source for gaming and non-gaming apps on iOS in most categories and regions. The remaining sources are distributed across sectors with significant variations:
➲ iOS gaming sector:
- Liftoff and Moloco are ranked 2nd and 3rd respectively. This shows the high quality of these media sources, because in the volume ranking their positions are not so high – Liftoff 10th place and Moloco 9th place.
- Meta Ads squeezed Google Ads well, ranking 4th in the ranking, especially succeeding in the midcore gaming category.
- AppLovin is in 5th place in the global rankings, showing success in Casual and HyperCasual gaming.
- IronSource received the 2nd place in the global ranking in the Casino and HyperCasual categories.
- TikTok For Business performed well in the Midcore (4th place) and Sports&Racing (5th place) categories.
- VK Ads in the EMEA East region in the Midcore category ranked 4th in power and 9th in volume.
➲ iOS non-gaming sector:
- Meta Ads leads the non-gaming segment of iOS, ranking 2nd globally, mainly due to the Life/Culture category. In terms of volume, Meta holds second place in the Utility Group, Shopping and Health&Fitness categories. In the Latin America region, Meta has the 1st place in the Life/Culture category.
- Google Ads is ranked #5 globally (3rd in volume) due to its strong presence in Finance rankings.
- Snapchat is #3 in global rankings and #4 in the Shopping category. In North America, Snapchat has a good position in the Life/Culture category (2nd place).
- TikTok For Business ranks 6th (4th in volume), moving up to 2nd in the global power ranking in the Utility group and 3rd in the Health&Fitness and Finance categories.
- VK Ads in EMEA East is ranked 5th in the Life/Culture category.
Remarketing Index Android

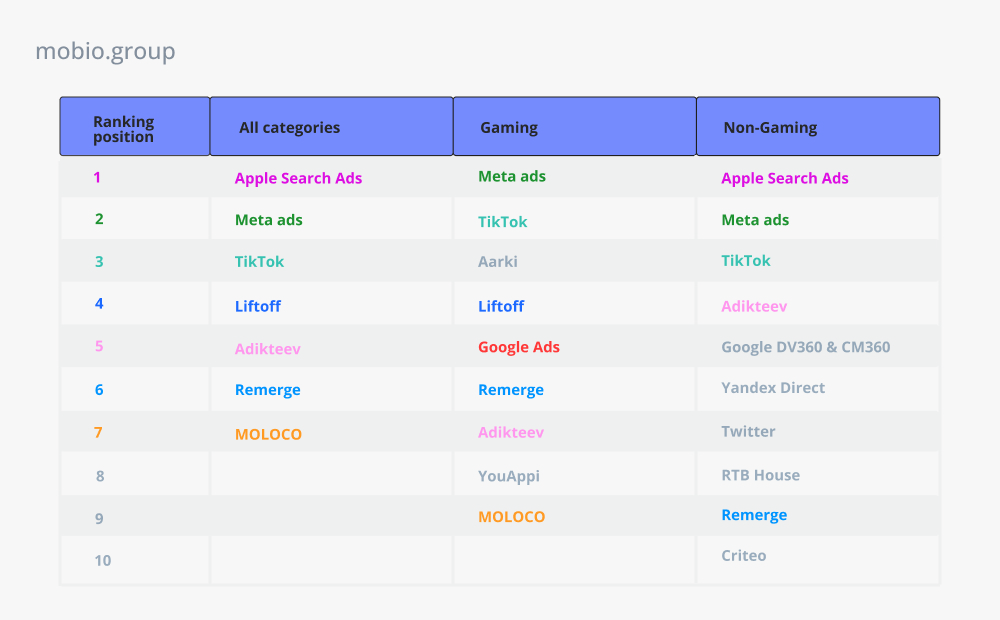
Google Ads is ranked #1 in the global rankings, with Meta Ads and TikTok For Business at #2 and #3 respectively, Liftoff ranked #4 for excellent quality (and #5 for volume), and Adikteev and Remerge ranked #5 and #6. Media resources that did not rank in all categories appear in the gaming and non-gaming sectors:
➲ Gaming remarketing sector:
- Google Ads slips heavily in the gaming sector in the Casino category, losing the #1 spot in the Meta Ads vertical.
- Aarki ranks 3rd in the vertical, performing well in terms of power and volume in the Casual category.
- TikTok For Business ranked 2nd in the Gaming sector due to performance in the Midcore category.
➲ Non-gaming remarketing sector:
- Google Ads ranks #1 in the global non-gaming rankings, but is behind TikTok in the Middle East and Africa region.
- Meta Ads’ success in the Shopping category has allowed it to close the gap with Google in the global ranking.
- X (ex. Twitter) performs well in the Finance and Food&Drink categories (5th place).
- Yandex Direct is ranked 4th in the Europe region in the Shopping category and 5th in Life/Culture.
- VK Ads is ranked 11th in the Life/Culture category in the Europe region and 8th in the Shopping category.
Choosing the right media sources and allocating advertising budgets remains a top priority for marketers. AppsFlyer’s 16th edition of the Performance Index serves as a guide for advertisers, identifying the most effective traffic sources and providing the information needed to make decisions.
It is noticeable how the trend of developing Self-service in-app sources (including game-channels) in non-gaming categories strengthens from year to year. In turn, we started to develop these sources a long time ago. Therefore, we can additionally confirm the effectiveness of these channels in non-gaming categories, including Shopping.
Daniil Krasheninnikov, Head of Performance, Mobio Group
Mobio Group’s expertise lies in helping our clients navigate and ensure their budgets are directed to the most appropriate media sources. Contact Mobio Group’s team of professionals for a one-on-one consultation and we will help you direct your efforts and resources where they will have the greatest impact, optimizing the results of your mobile advertising campaigns.


